Goal setting is an actively productive foundation for achieving anything in life and in business. However, for many people, it's also the last step ever taken because it's so easy to lose sight and forget about those goals, especially if they're not clearly defined.
To make it to the finish line, it helps to measure performance i.e. KPI (key performance indicators) in a visual manner. Not only does this keep you engaged with your goals and objectives, it also serves to remind you of your progress relative to your goals. In other words, it reminds you to keep your eyes on the prize.
Below is a step-by-step guide to setting up your KPI dashboards using Google Sheets.
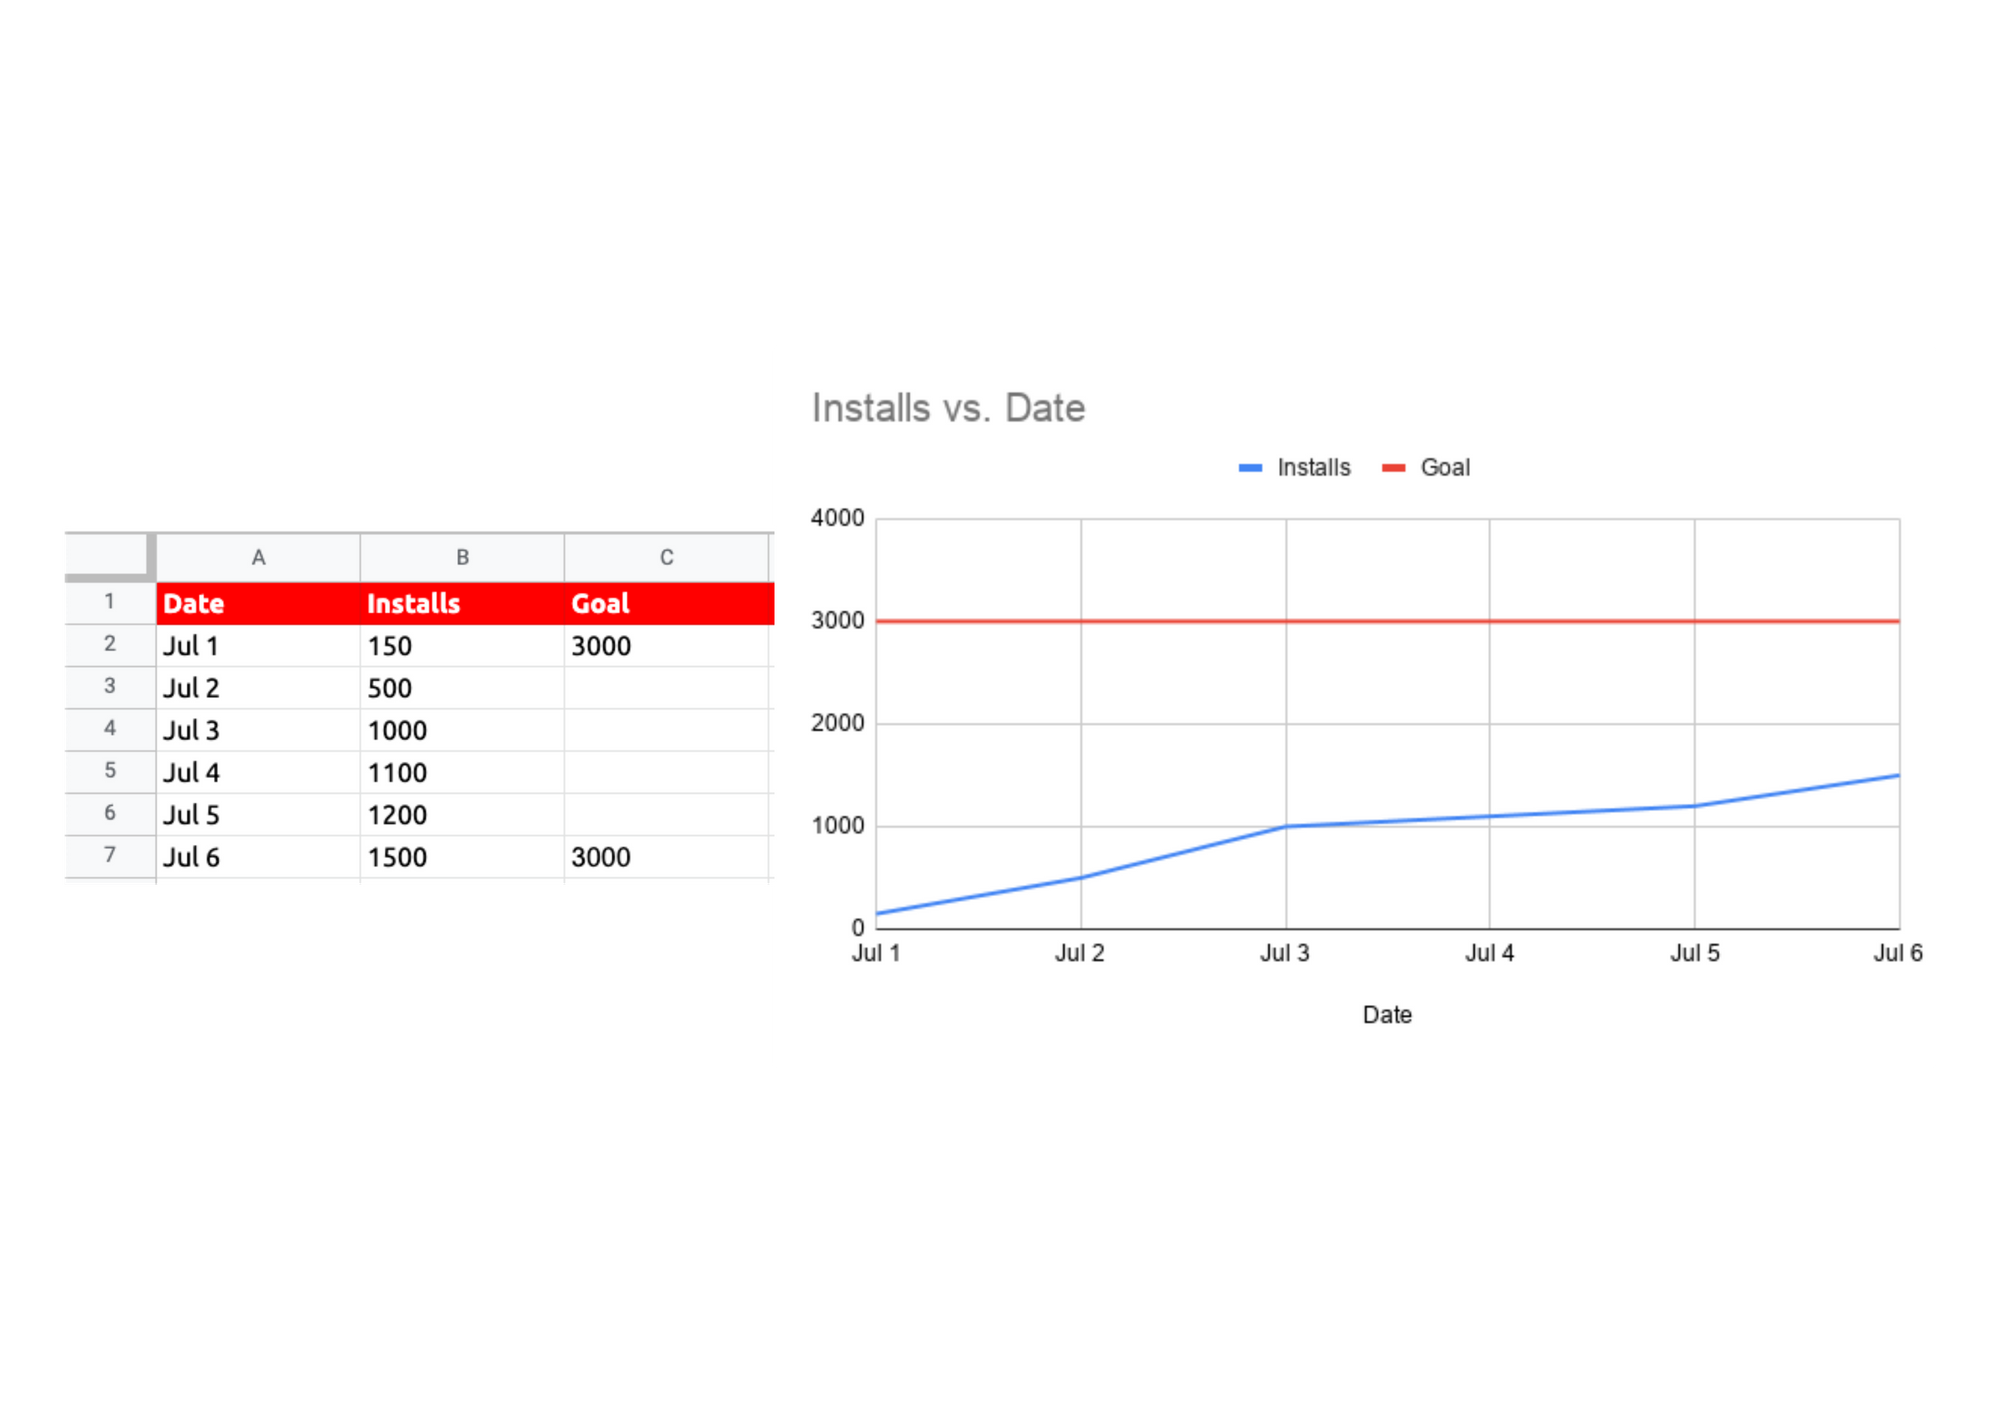
Begin by tracking your metrics. In this example, the metric is tracked daily for the number of app installed. However, you can also track weekly or monthly if there is only minimal change from day to day.
💡 Insert > Chart. The corresponding chart helps with data visualisation which is much easier to process than having the data laid out flatly in the table.
Outcome: This tells us the number of installs that we reach per day.
The metric by itself, doesn't tell us much. We need to add our goals as a benchmark for comparison.
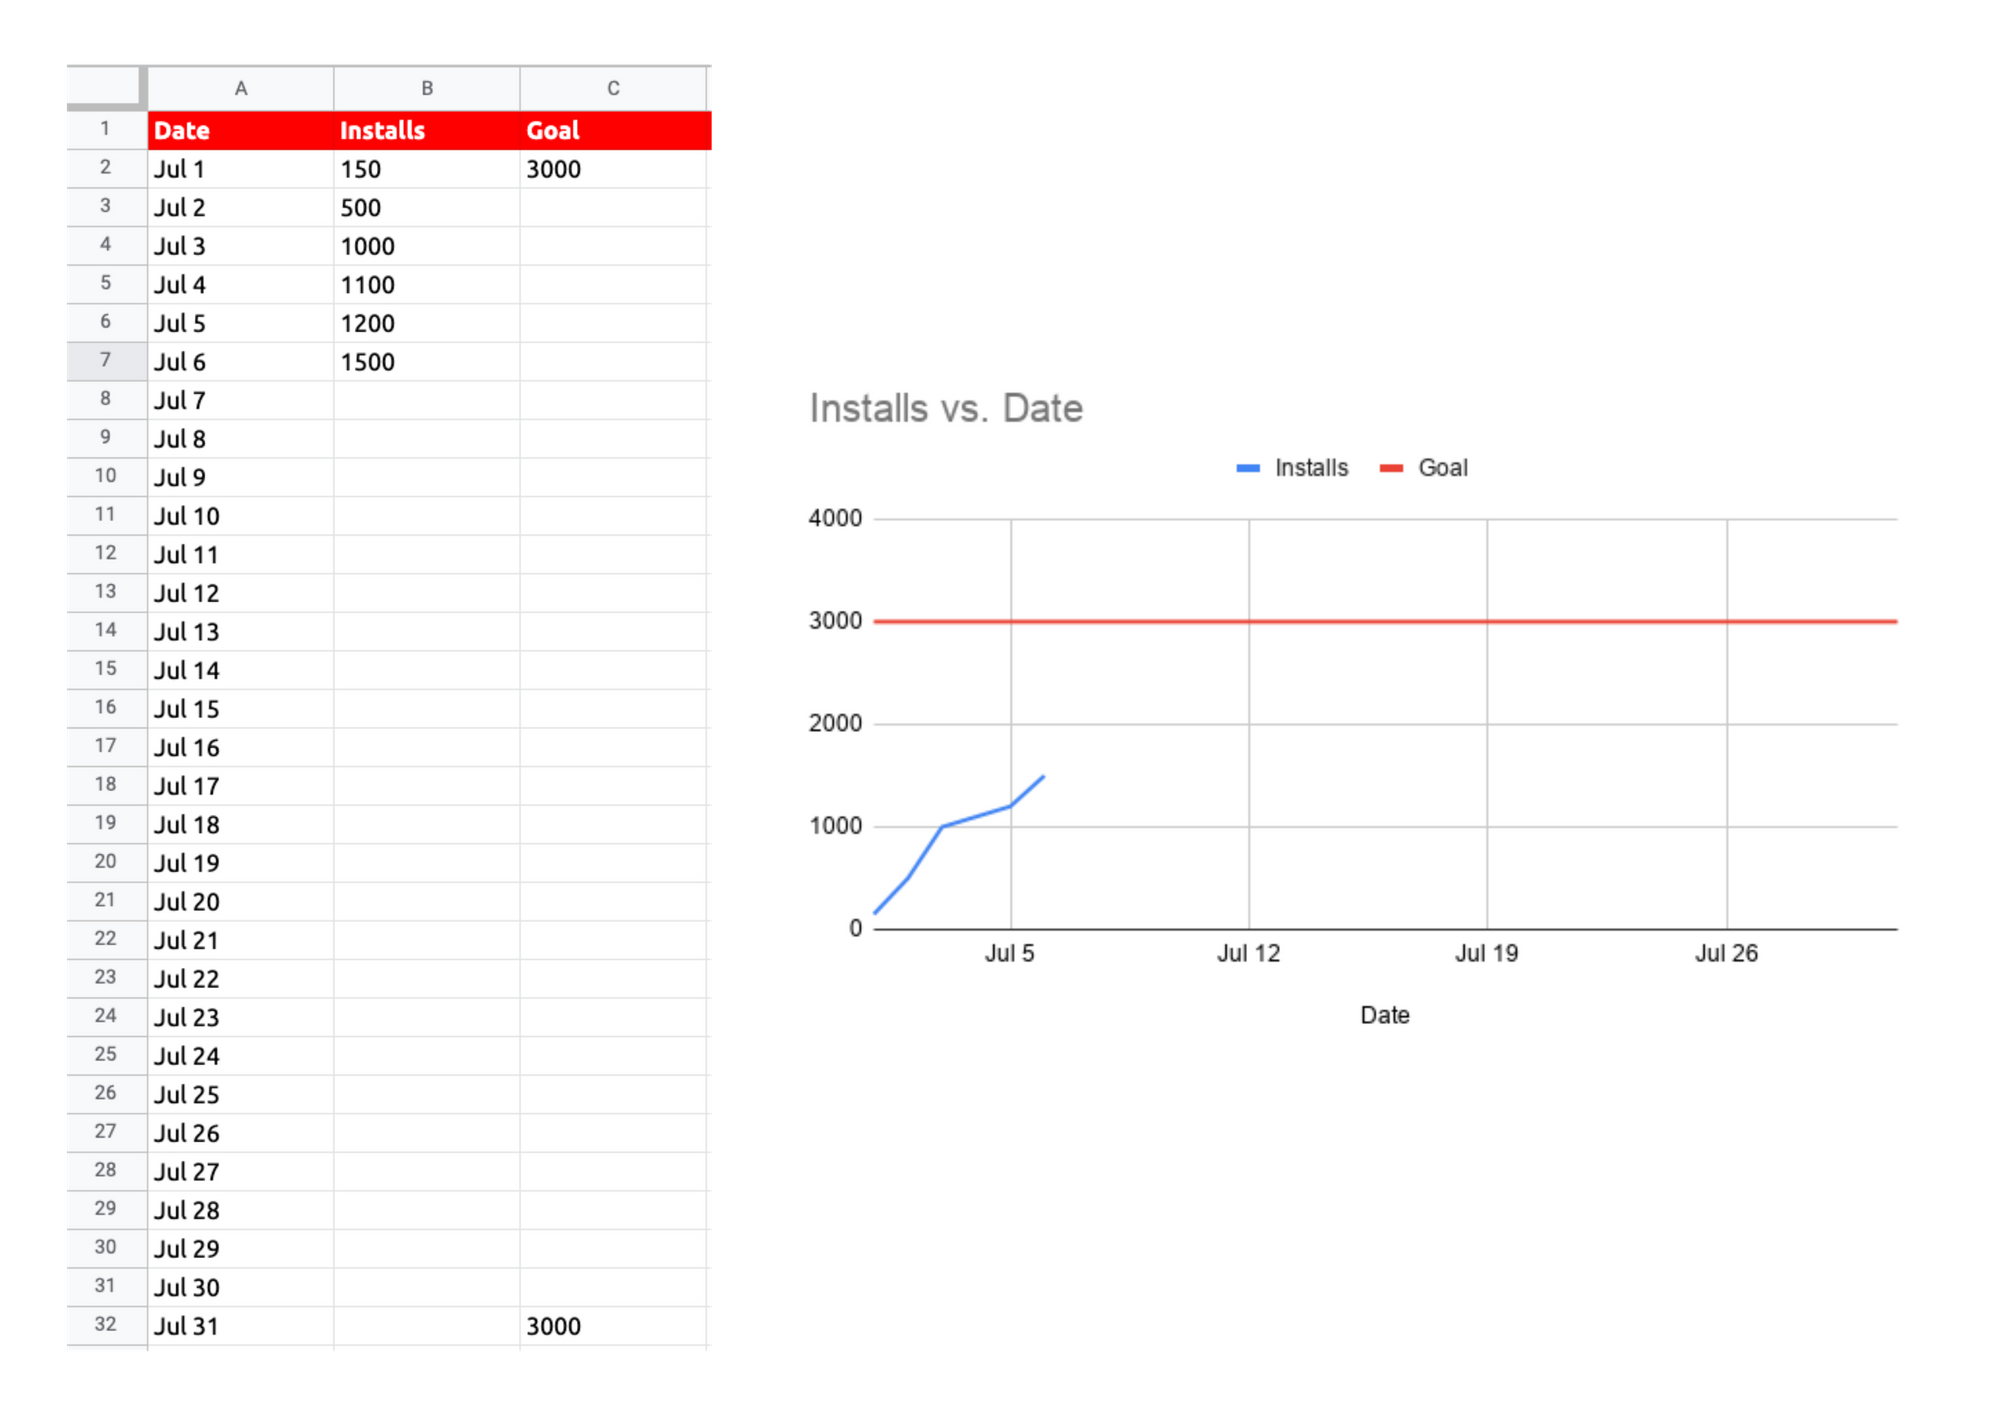
💡 Chart Editor > Customise > Chart Style > Plot Null Values. To connect the first 'goal' data point and the last to create a solid line.
💡 Chart Editor > Customise > Vertical Axis > Maximum. To change the maximum value on the vertical axis so that the goal line isn't on the boarder of the chart.
Make sure you plan accordingly to display the entirety of your campaign, as the long term visualisation will help keep focus. In this example, our goal is to reach 3000 downloads in a period of one month's time, so we have expanded the range until the end of July.
Outcome: The dashboard tells us how far we are from the goal and how much time we have to reach it.
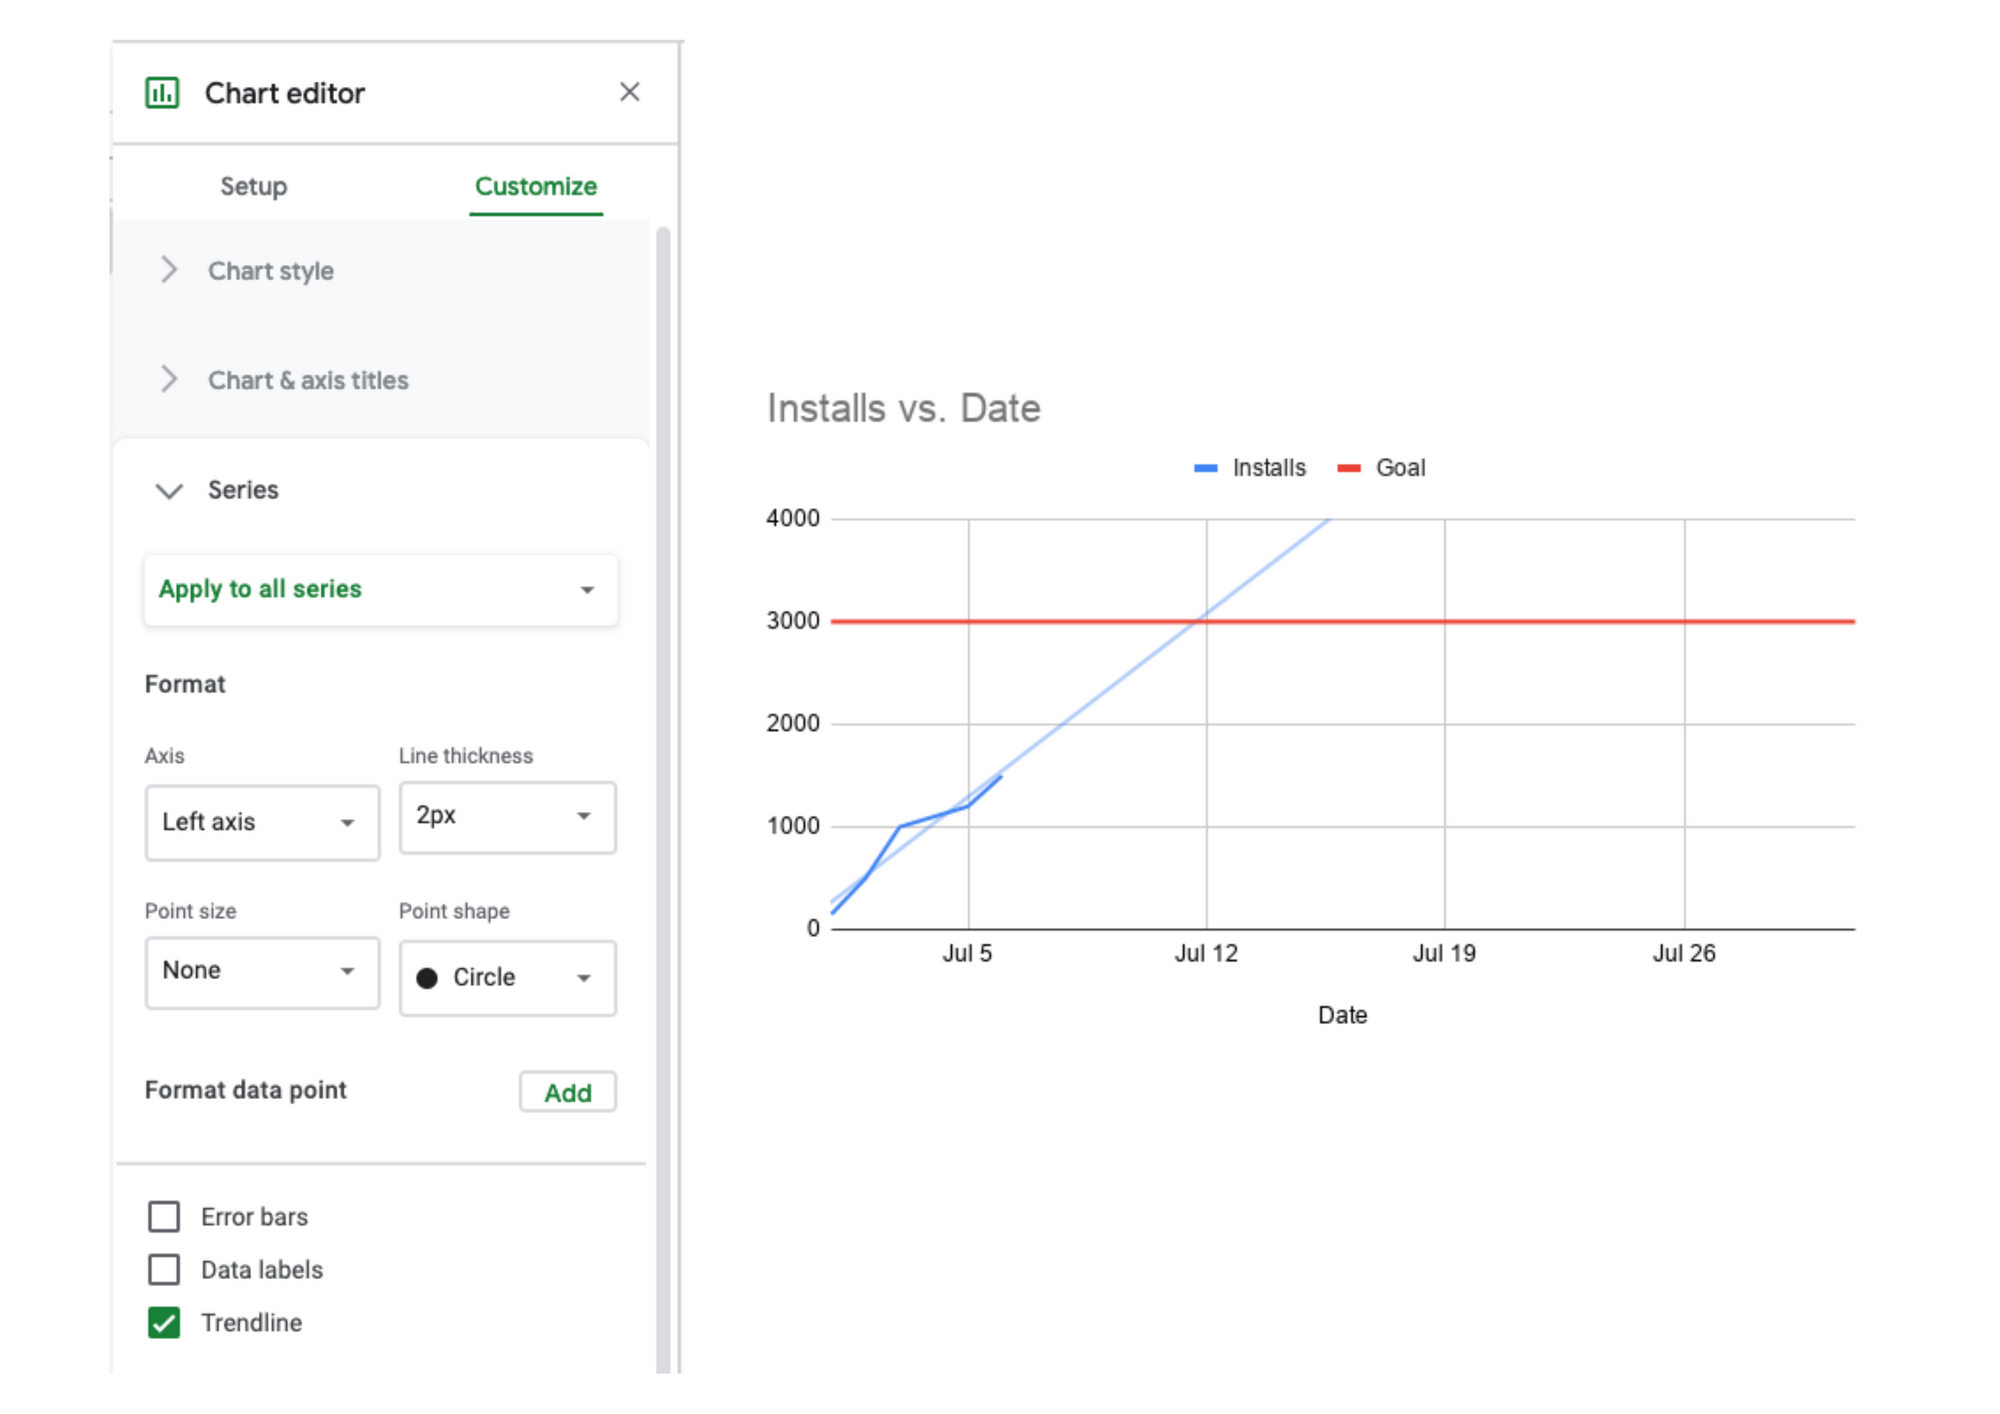
Make use of the 'trendline' functionality to accurately predict the trend of our metric (how it behaves based on the existing data points).
💡 Chart Editor > Customise > Series > Add Trendline.
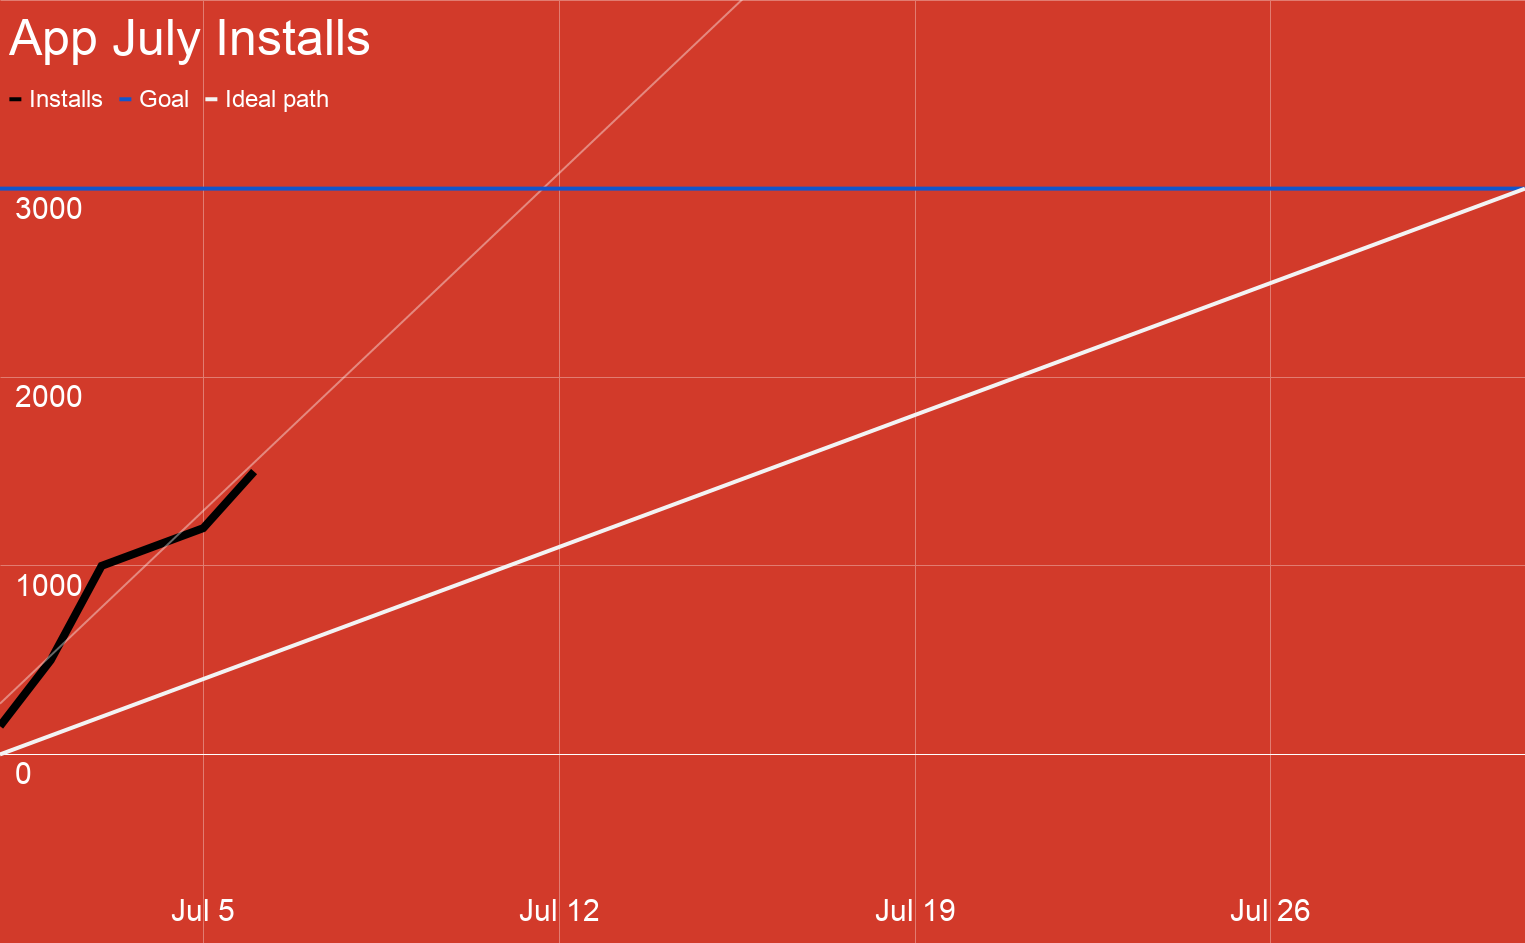
Outcome: So far so good. The 'trendline' shows we are more or less on track to achieving our goal.
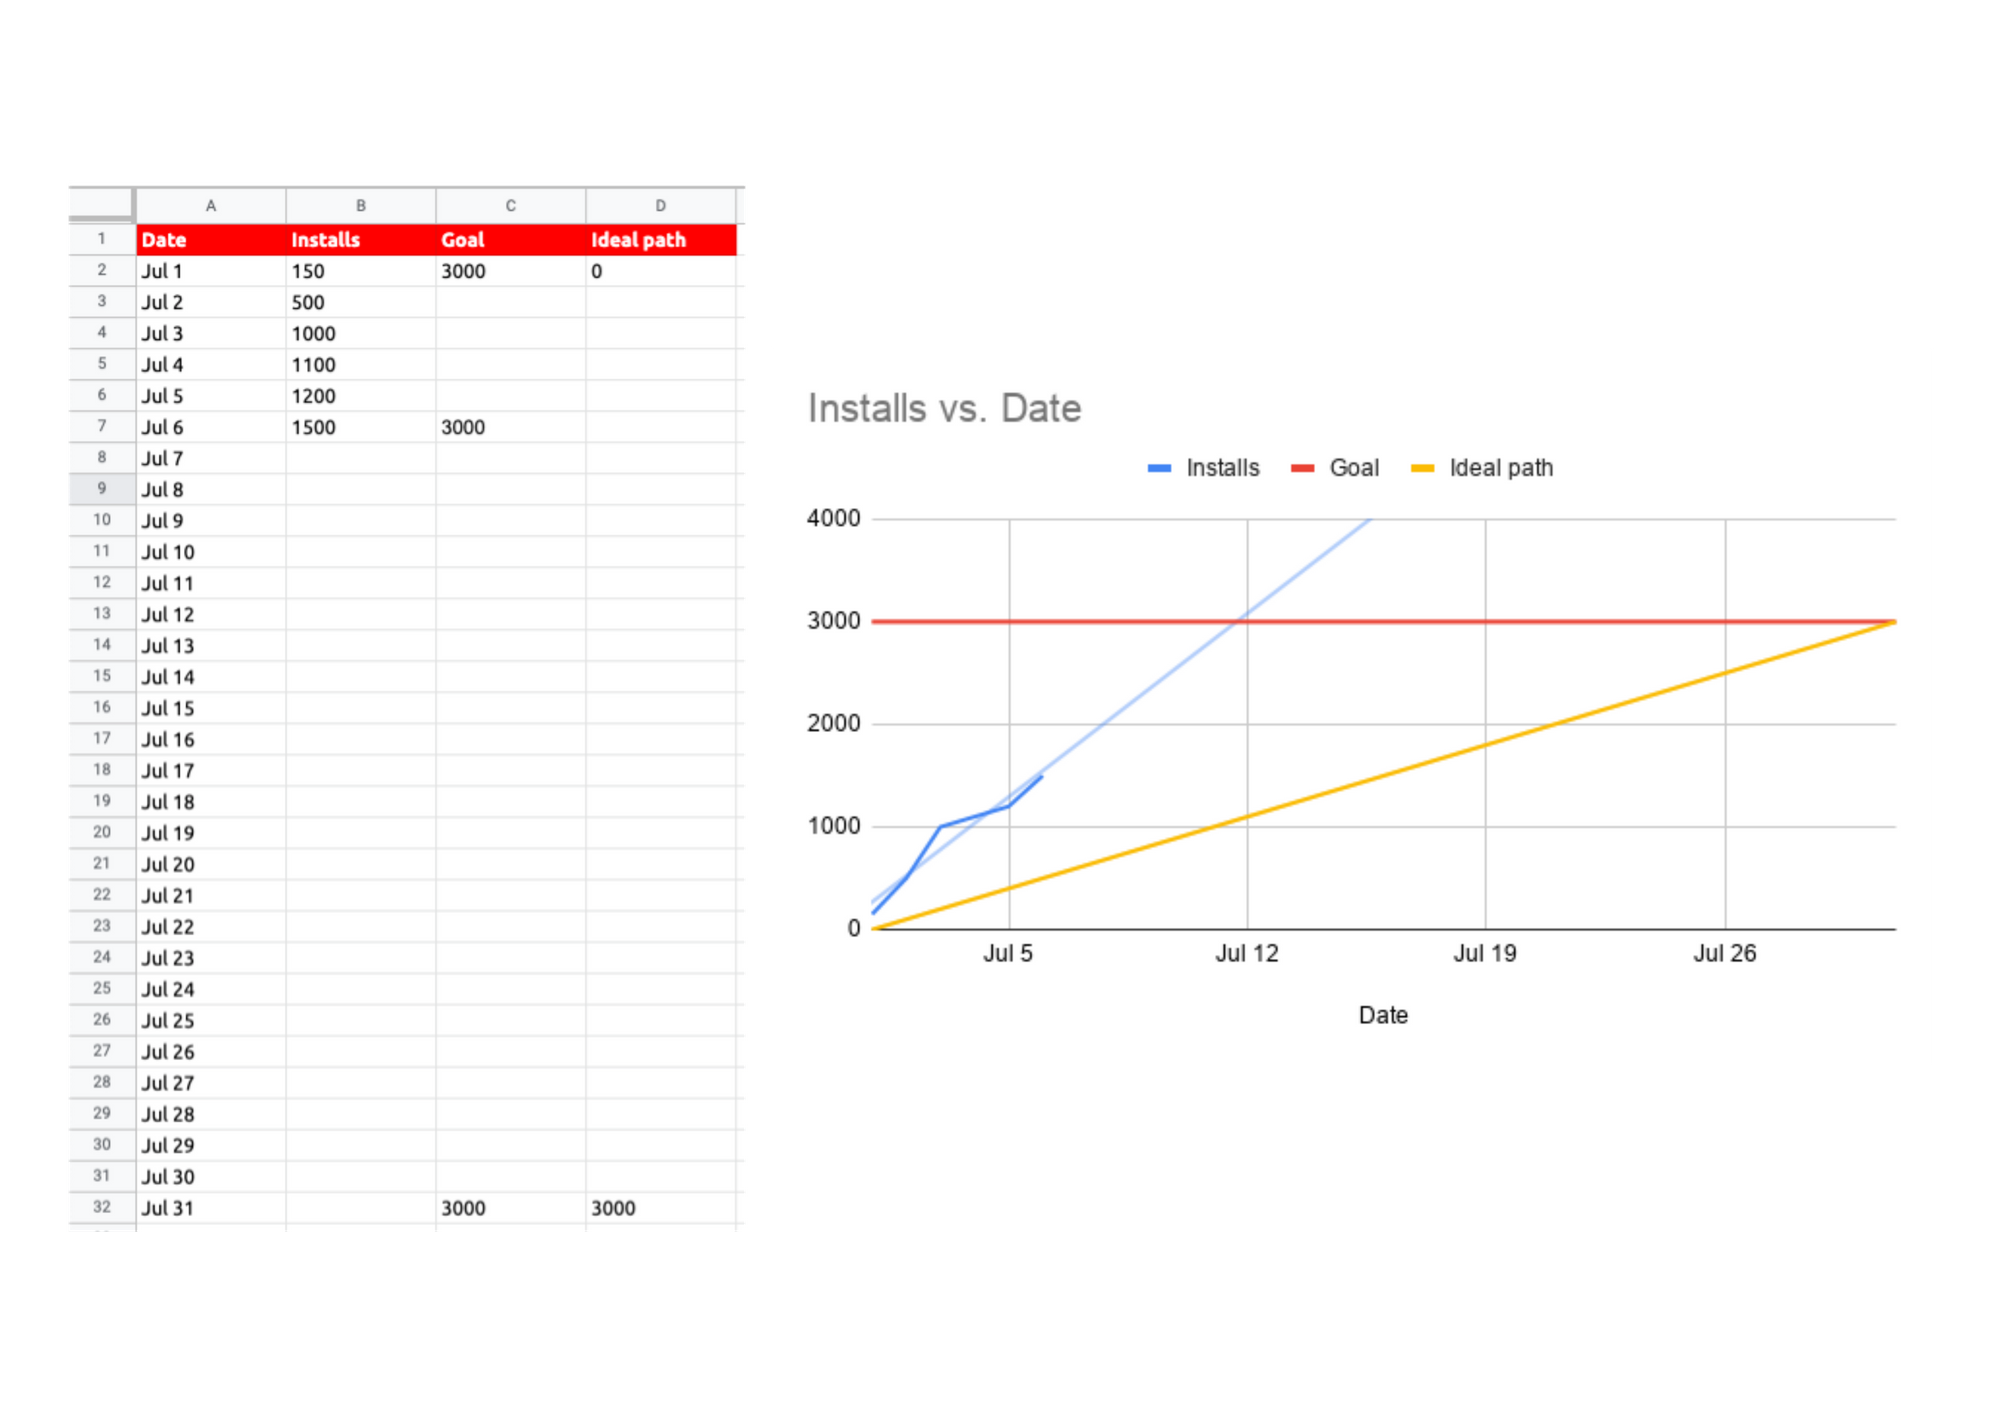
For good measure, the 'ideal path' is added in a new column to see how much the 'trendline' deviates from the ideal path.
Outcome: In the given example, it looks like we are (more than) on track to achieving our goal.
Now that we have all the essential data points plotted, presentation awaits. It's time to make it TV-Friendly for the big screen.
A quick customisation can do wonders. The example below shows how a simple increase in text size and colour customisation can transform the look of the chart. It's hard to guess that it was done only using Google Sheets.
💡Chart Editor > Customise > Chart Style > Maximise.
💡Chart Editor > Customise > Play around with text size & colours.
Google Sheet passes our simplicity test.
Complexity level: beginner.
Time to complete: ≈5 minutes.
Result: exceeds expectation.
It may be unexpected to find a solution for something that sounds as technical, and as complex, as a 'data visualisation dashboard' in a free software like Google Sheets. However, at Mäd, we like to keep it simple. It's the art of doing twice the work in half the time (and effort). Work smart, work hard, but work more efficiently.
For further reading, we also discuss the effectiveness of simple quarterly planning, which can be accessed through our insight linked below.
Work with our expert team to get measurable results.
Together we can Make It Happen.™


